

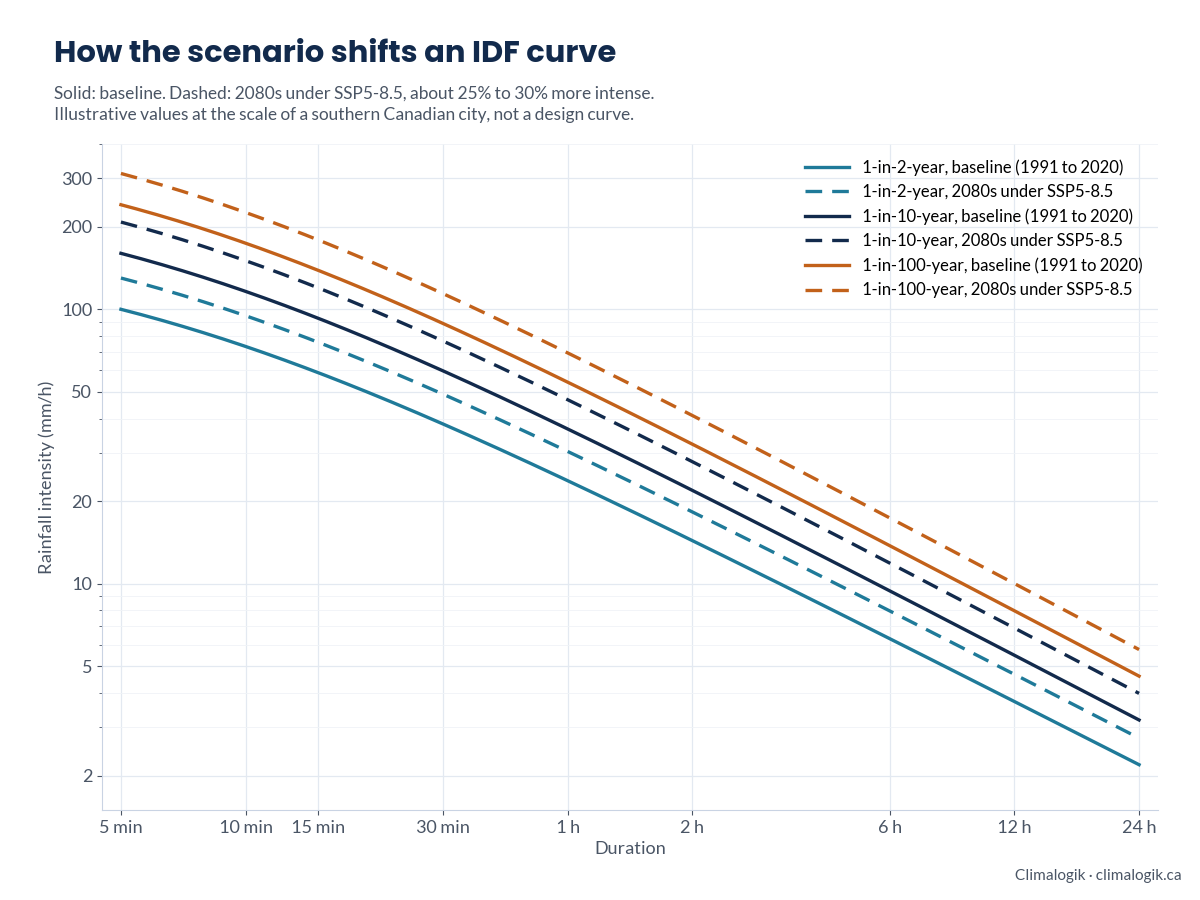
An IDF curve tells your engineers how hard it rains, for how long, and how often. Climate projections change those numbers, and the scenario you choose decides by how much.
What an IDF curve is
Intensity-Duration-Frequency curves give the rainfall intensity to design for, for each storm duration, from minutes to a day, and each return period, from a 2-year storm to a 100-year storm. Most are built from the annual maximum rainfalls recorded at a station. That makes them a record of the past climate: they assume tomorrow’s storms behave like yesterday’s.
Why warming changes them
Warmer air holds more moisture, about 7% more for each degree Celsius. The IPCC’s Sixth Assessment Report projects that extreme daily precipitation intensifies by about 7% for each 1 °C of global warming. Short, intense storms, the ones that size culverts and storm sewers, can change by as much or more in some places. A climate-adjusted IDF curve moves the design values toward the climate the asset will experience.
What SSP5-8.5 is
SSP5-8.5 is one of the Shared Socioeconomic Pathways used in CMIP6 and the IPCC’s Sixth Assessment. It describes very high emissions, reaching a radiative forcing of about 8.5 W/m² by 2100, and gives the most warming of the main scenarios, with a best estimate of about 4.4 °C above pre-industrial levels by the end of the century. It was never a forecast. Scenario developers now consider emissions that high implausible, and the scenarios prepared for the next IPCC cycle replace it with a lower high-emissions pathway. The new set is expected to span from about 1.5 °C to almost 3.5 °C of warming by 2100.
So which scenario should your curve use?
Match the scenario to the asset, not the other way round. A common approach:
- Short-lived or easily upgraded assets: a middle pathway such as SSP2-4.5, to the end of the asset’s design life.
- Long-lived or high-consequence assets, such as dams, major culverts and critical facilities: test the design against a high pathway or a global warming level of 3 to 4 °C, so it still holds if emissions stay high.
- Every case: use many models, report the range, and state which value from that range goes into design.
In Canada, CSA PLUS 4013 sets out how to develop and use rainfall IDF information, including under climate change. Environment and Climate Change Canada recommends scaling historical IDF values with projected local warming, and ClimateData.ca publishes climate change-scaled values for its IDF stations. Your consultant should be able to tell you how their method relates to both.
Five questions to ask your consultant
- Which scenarios or global warming levels, and why those?
- How many climate models, and which downscaled dataset?
- How is the curve adjusted: scaled with temperature, or from downscaled rainfall?
- What is the range across models, and which value goes into design?
- To which year, and does that match the asset’s design life?
We build climate-adjusted IDF curves, design storms and probable maximum precipitation for municipalities and infrastructure owners.
Sources
- IPCC Sixth Assessment Report, Working Group I, Summary for Policymakers (sections B.1 and B.2)
- CSA PLUS 4013:19, Technical guide: Development, interpretation and use of rainfall IDF information
- ClimateData.ca: IDF data and climate change
- Eos: why the IPCC seems poised to eliminate its most extreme emissions scenario
- The Scenario Model Intercomparison Project for CMIP7 (ScenarioMIP-CMIP7), Geoscientific Model Development, 2026