

Climate adaptation
Hydrometeorological and hydrological extremes
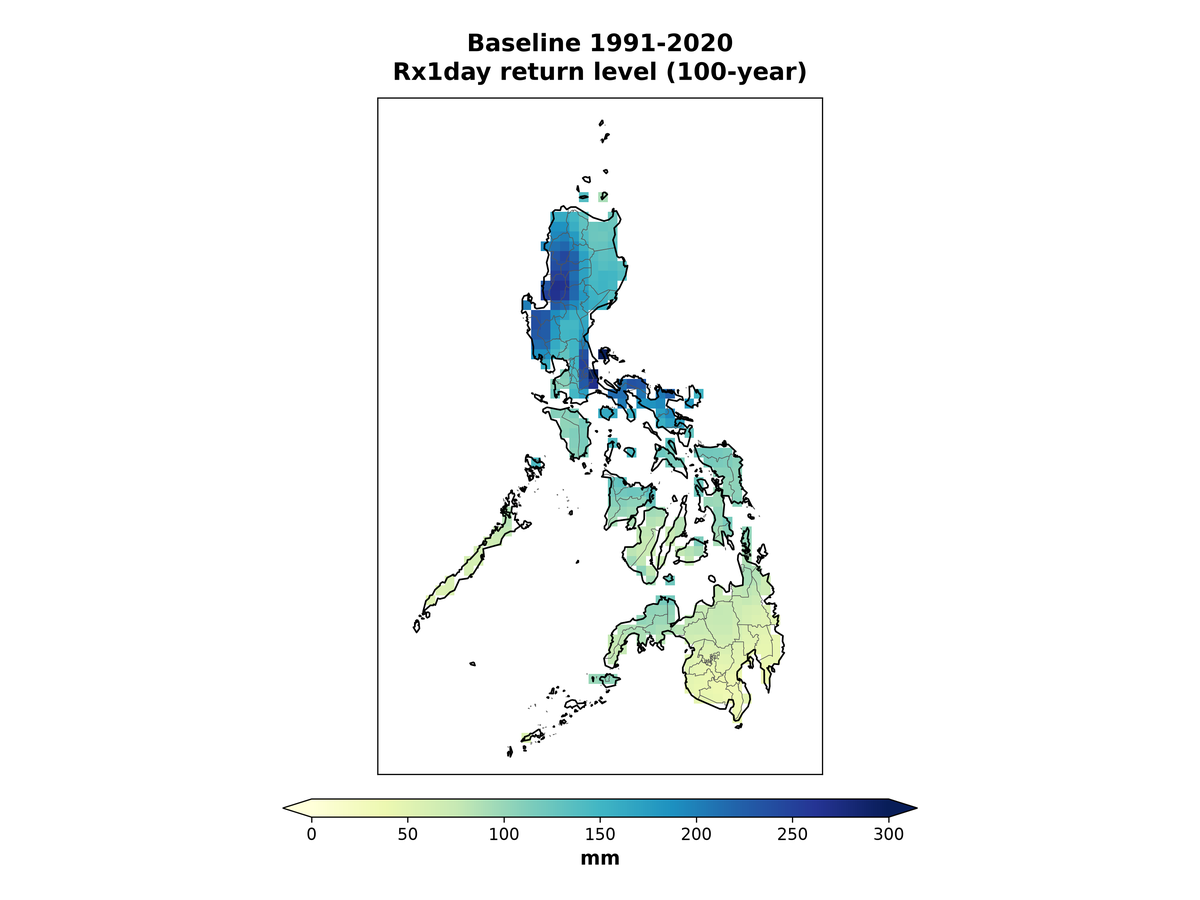
Design values for extreme rainfall, floods, freezing rain, heat and drought, estimated for the historical and the projected future climate.
Design for the climate the asset will face
Considering climate change can make a huge difference in infrastructure design. When building bridges, engineers have long considered how fast a river might flow or how strong the wind might blow. When designing roads and airport runways, they consider how hot temperatures might be or how high flood waters might rise. When designing dams and reservoirs, engineers consider precipitation patterns and the intensity and frequency of floods and droughts. Commercial and residential buildings and the electric grid also require engineers to consider the forces of climate they must withstand. Until recently, engineers could confidently assume that the statistics of past weather represent the future climate, an assumption known as stationarity. This is no longer true. Increasingly, engineers must consider the effects of climate change, non-stationarity and uncertainty in future climate.
Engineers need a new blueprint to prepare for a future that is hard to predict. Where can they get actionable, design-relevant information about future climate, and how should they incorporate it into their designs, given the uncertainties in climate projections? Not all the climate statistics relevant to the design, planning and operation of assets are available from climate model outputs, which are usually archived as daily values and summarized as long-term averages. Yet decisions on asset integrity and safety may rest on short-term statistics or extreme values, such as the maximum expected 10-minute wind speed or the 1-in-10-year rainfall event. The best way to answer such questions is for engineers to work closely with climate scientists to understand which types of climate information prove most useful in which situations.
What we do
- IDF curves, current and future. Station and regional intensity-duration-frequency analysis following guidance such as CSA PLUS 4013:19, and climate-adjusted curves using approaches such as downscaled projections, temperature scaling and non-stationary frequency analysis.
- Design storms and flows under climate change. Hyetographs and design flows for stormwater systems, culverts, bridges and roads.
- Probable maximum precipitation. PMP estimated largely with statistical methods, and with storm-based approaches such as moisture maximization and transposition, or numerical storm modelling, where a study warrants them. We follow guidance such as the WMO Manual on Estimation of Probable Maximum Precipitation (WMO-No. 1045) and British Columbia’s 2020 PMP guidelines, and adjust for climate change.
- Probable maximum flood. PMP, snowpack and snowmelt inputs to PMF studies for dam safety under the Canadian Dam Association guidelines.
- Flood frequency analysis. Stationary and non-stationary methods with distributions such as GEV, at gauged and ungauged sites.
- Freezing rain, wind and heat. How often ice accretion, extreme winds and heat occur, for electric utilities, buildings and transport.
- Drought. Indices such as SPI and SPEI at time scales from 1 to 48 months, and drought duration and severity.
- Cold regions and permafrost. Freezing and thawing indices and the climate drivers of permafrost for northern infrastructure and mine closure.
- Codes and guidelines. Climate inputs to design codes and guidance, including the update of the Canadian Highway Bridge Design Code.
We follow recognized standards and guidance such as CSA PLUS 4013:19, the climatic design data of the National Building Code of Canada 2025 and CSA S6:25, the Canadian Dam Association Dam Safety Guidelines (2013) and technical bulletins, the WMO Manual on Estimation of Probable Maximum Precipitation (WMO-No. 1045), British Columbia’s PMP guidelines (2020), the Federal Flood Mapping Guidelines Series and IPCC AR6.
See also: Flood hazard mapping and risk assessment · Hydro-meteorological forecasting
What you receive
- IDF curves and design storms
- Probable maximum precipitation and floods
- Freezing rain, heat and drought indices
- Design floods under climate change
Also covers: Non-stationary IDF curves · Design storms and flows under climate change · Probable maximum precipitation (PMP) · Probable maximum flood (PMF) · Flood frequency analysis · Flood hazard mapping and risk assessment · Drought analysis · Design-relevant climate values · Codes and guidelines for climate-resilient design · Hydrometeorological extremes
Water resources and climate change: Extreme precipitation event analyses · Flood and drought risk under climate change · Coastal storm surge and sea level rise · Climate forcing data for hydrological models (CRHM, Raven, MESH) · Dams and reservoirs under climate change · Climate change impacts on hydrology and water resources · Streamflow under climate change. See Hydrological monitoring, modelling and simulation.
Methods
We choose methods to fit the asset and the decision, such as:
- GEV and non-stationary frequency analysis
- IDF analysis following CSA PLUS 4013:19
- Temperature scaling of short-duration rainfall
- PMP by statistical and storm-based methods
- PMF inputs for dam safety
- Climate change allowances in flood estimation
- Design storms for future time horizons and warming levels
- SPI and SPEI drought indices
Questions we help answer
- What rainfall intensity should this culvert, bridge or spillway be designed for over its service life?
- How should IDF curves be adjusted for climate change, consistent with CSA PLUS 4013?
- What are the PMP and PMF for this watershed today, and how might they change?
- How rare was a past flood, and what is the 1-in-100-year flow now and in the future?
- Which design temperature, wind or snow values should change over the life of the asset?
The work
Projections to 2150
Giant Mine: climate for perpetual care
Downscaled hourly climate projections
EPRI: Ontario electric sector adaptation investments
From our Insights: What SSP5-8.5 means for your IDF curve
Discuss your project
Start with a 30-minute call with a climate scientist about your question, your data and your timeline.