

Front-office climate services
LastMile
Climate to Decision
Already have a climate risk assessment? LastMile brings its results to residents on your Climate Map: the hazards, risks and actions for each neighbourhood, ready to explore. You host it under your name, and it is refreshed as the science changes.
The gap we close
The science exists, but residents rarely see it
Your assessment took months of work and a significant budget. Canada’s 2023 national synthesis lists the barriers that slow adaptation, among them limited resources, poor coordination and limited access to relevant data and information. LastMile goes straight at the third and eases the other two.
Limited resources
You have already paid for the assessment. LastMile gets it used without commissioning a new study.
Poor coordination
Council and residents see the same risks, on the same map.
Limited access to relevant data
Residents see projections for where they live, in plain language, not in appendices.
How it works
- Your assessmentAny framework: PIEVC, BARC, Envision, ISO 31000, Low Carbon Resilience or a custom CRVA.
- Your Climate MapThe results mapped by neighbourhood, ward or district in the LastMile-ready schema, ready to publish on your ArcGIS or QGIS. Confidential information stays off the public map.
- ResidentsThey see the hazards and risks where they live, and what is being done about them. The map is updated when the science or your information changes.
What’s in your Climate Map
Three layers residents can explore
Published under your name.
Climate Layers
How each hazard changes where people live: climate indices by time horizon and scenario, for each neighbourhood, ward or district.
Risk Layers
Your assessment’s results by area: risk ratings and hotspots, explained in plain language.
Action Layers
Your adaptation plan on the map: what is being done, where, and how far along it is.
What keeps it working
Engagement
Climate Stories
Story map, artist’s rendering and plain-language explainers for residents and council.
Refresh
Climate Check-up
Updated when ClimateData.ca or the regional hubs publish new projections, or when your information changes.
Capacity
Climate-Ready Training
Training for the team that keeps the map current and the people who take it to the community, so it outlasts staff turnover.
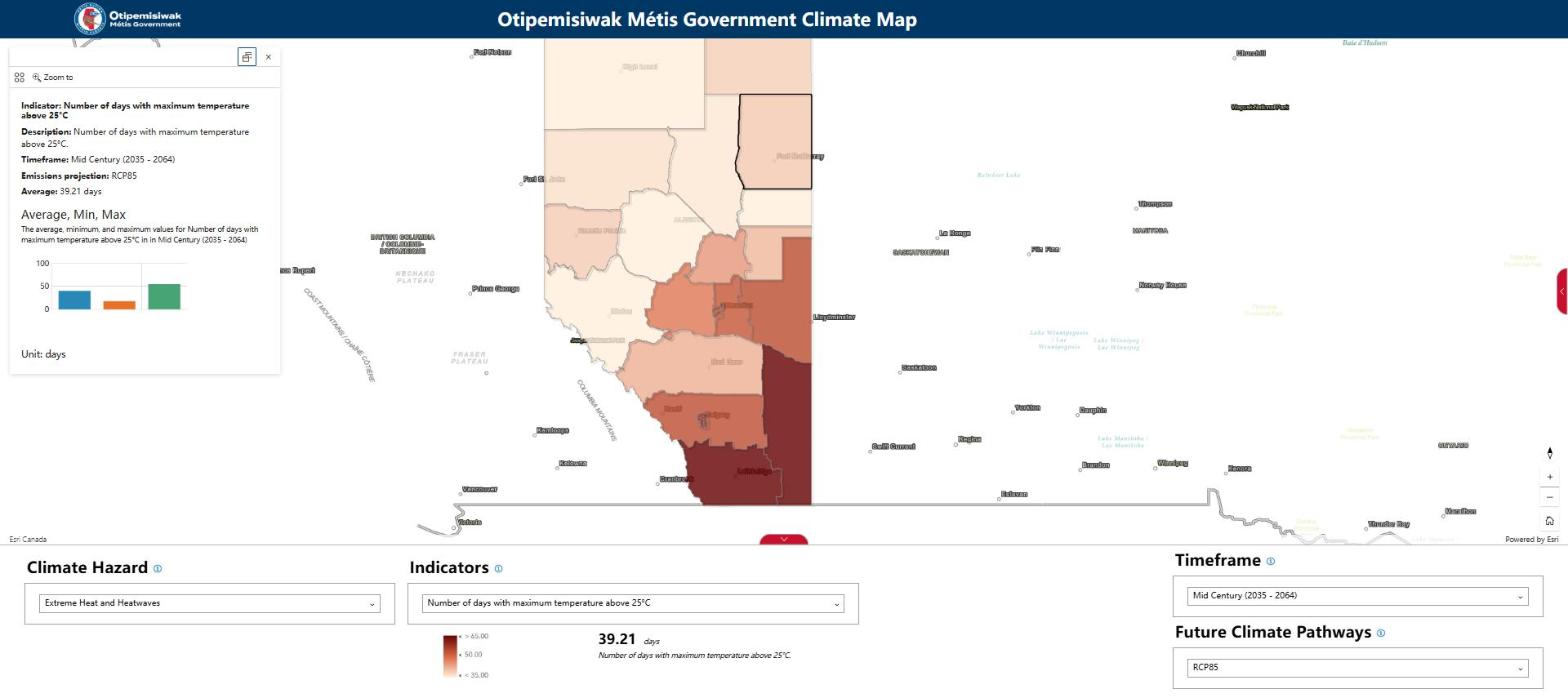
A Climate Map in practice
Métis Nation of Alberta: 22 districts, 8 hazards, one map
The Nation’s climate risk and vulnerability assessment, brought to each of its 22 districts on one interactive map.
The LastMile-ready schema
From assessment to Climate Map
One data model links every hazard to the places, risks and actions it touches. Residents see the whole picture for their neighbourhood, and the map can be updated quickly when the science changes.
What a resident sees
Ward 4 · extreme heat: days above 30 °C rise from 9 to 27 (range 18 to 36) by the 2050s under SSP5-8.5 · water treatment plant: high risk · action: backup power and cooling, funded for 2027.
Public by design
Residents see hazards by neighbourhood, risk ratings, action status and plain-language explainers. Fields you mark confidential, such as asset condition or data on vulnerable residents, never reach the public map. You host it; we never hold resident data.
Works with what you have
Built for ArcGIS Online, ArcGIS Enterprise or QGIS, in open formats your GIS team already uses.
The product sheet and the full schema specification are available on request.
For RFP writers
Writing an assessment RFP?
Ask us for a sample deliverables clause. Whoever wins the work then delivers results ready to publish for residents.
The clause asks for climate, risk and action layers in open GIS formats, scores linked to the place, asset and hazard they come from, and a public or confidential flag on every field.
For the team that hosts it
- Hosting: ArcGIS Online, ArcGIS Enterprise or QGIS, under your organization’s name.
- Your data: you own the layers, and only fields you mark public reach the map.
- Refreshes: each update is versioned, so earlier ratings stay traceable, and a practitioner reviews every change before it goes live.
Questions councils ask
Who is the map for?
Residents. They see the hazards and risks where they live, and what is being done about them.
Who owns the layers?
You do.
Where does confidential data sit?
With you, off the public map. Climalogik never holds resident data.
How often is it updated?
When ClimateData.ca or the regional hubs publish, or when you tell us something changed.
What does it cost?
It depends on your assessment and the area it covers. Ask us for a quote.
What if we have no assessment yet?
We do those too. See climate risk assessment.
Your map, under your name. Every Climate Map is published under your organization’s name, on your own systems, with a small “built with Climalogik” credit.
Put your assessment in residents’ hands
Send us the assessment you have. We’ll show you what residents would see.