

The winter of 2026–27 is a critical season for industries that rely on frozen ground, such as construction, oil and gas, and the resupply of remote communities. An El Niño is under way, and forecasters expect it to be very strong. In past El Niño winters, temperatures have been warmer than average across much of Canada and the northern United States, so these industries should include a shorter and less reliable season in their contingency planning.
Winter roads, ice bridges and construction on frozen ground depend on sustained cold from early in the season, which makes the forecast a serious operational risk. After several years of practical and operational climate services work, I decided to put together this piece. It sets out the state of El Niño and the seasonal forecasts for Canada, and what they mean for frozen ground, river ice and the operations that rely on them. I use the records of past El Niño winters as evidence for what to expect in 2026–27.
Summary
- El Niño 2026–27 is still strengthening and is expected to last through the winter. The U.S. Climate Prediction Center (CPC) gives about a 60% chance that it will be the strongest since 1950.
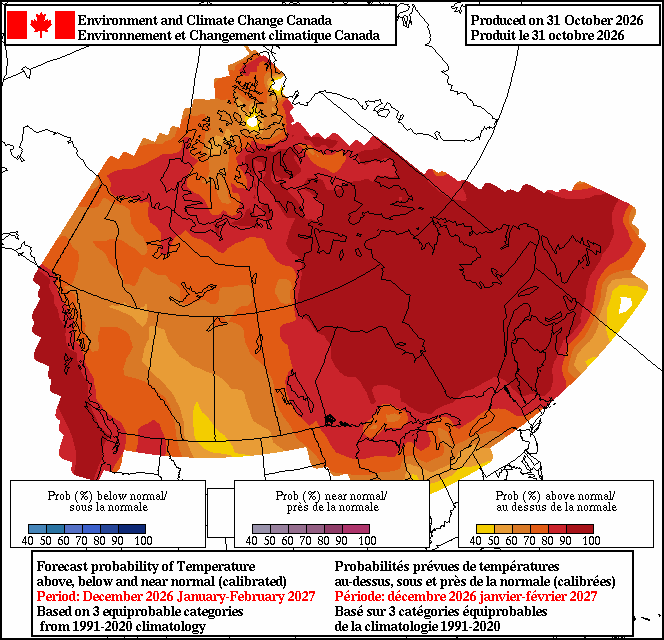
- The seasonal forecast from Environment and Climate Change Canada (ECCC) makes a warmer-than-normal December to February the most likely outcome across almost all of Canada.
- Cold has been slow to accumulate this autumn. From 1 October to 15 November, Yellowknife accumulated 67 freezing degree days; the median for the same period in 28 earlier winters is 207. Island Lake in Manitoba accumulated 13, against a median of 71 in 22 winters.
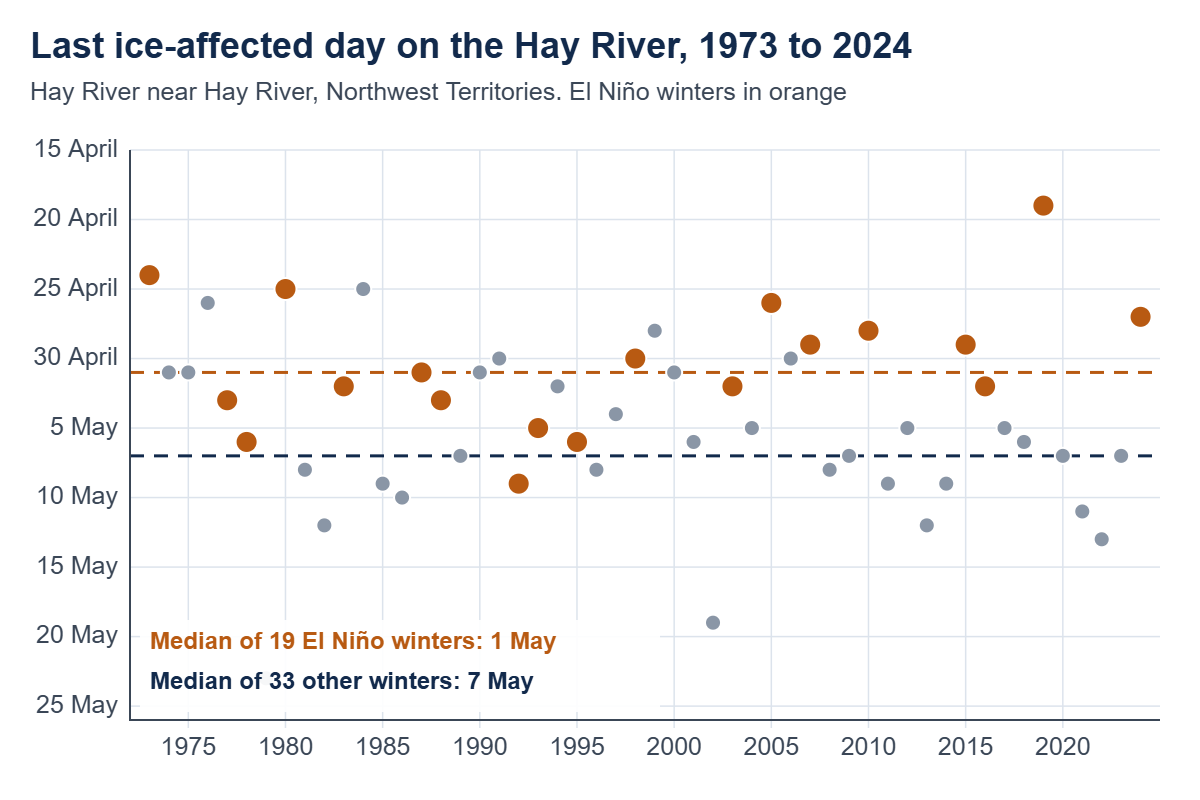
- Records from past El Niño winters support planning for a late start and an early end. At Big Trout Lake in northern Ontario, freezing degree days reached 380, a count associated with a favourable start to winter road construction, 10 to 15 days later than usual in 2015–16 and 2023–24. On the Hay River and the Mackenzie River at Fort Simpson, the ice season has ended five to six days earlier in El Niño winters than in other winters.
- A mild winter still has cold spells, and a seasonal forecast gives probabilities. My recommended planning steps for owners and operators are at the end of this piece.
Status of El Niño in November 2026
On 12 November 2026, the CPC kept its El Niño Advisory in place and reported that the event was still strengthening. It gives about a 60% chance that this El Niño will be stronger than any since 1950, and expects it to begin weakening in early 2027. The World Meteorological Organization (WMO) puts the chance that El Niño lasts through February at nearly 100%. All 27 models collected by Columbia University’s International Research Institute for Climate and Society (IRI) classify it as very strong through the winter.
How El Niño strength is measured
El Niño strength is measured by the sea surface temperature anomaly in the Niño-3.4 region of the central equatorial Pacific (5°N to 5°S, 120° to 170°W), averaged over three months. The traditional index, the Oceanic Niño Index, compares that temperature with a 30-year average. El Niño conditions begin at +0.5 °C, and an event is classed as very strong at +2.0 °C or more.
Because the tropical oceans are warming, the traditional index now overstates El Niño. The relative index subtracts the average anomaly of the whole tropical ocean (20°N to 20°S) from the Niño-3.4 anomaly, so it measures how warm the region is compared with the rest of the tropics. That contrast is what shifts tropical rainfall and the atmospheric circulation, and through them the weather in distant regions. The WMO recommends the relative index, and the CPC now uses it for its outlook, with the same thresholds.
On the relative index, the three very strong events since 1950 peaked at 2.4 (1982–83), 2.3 (1997–98) and 2.3 (2015–16). The 2023–24 event peaked at 1.4, although it ranked among the five strongest on the traditional index. The current event reached 2.0 for August to October 2026, the latest three-month value. On the traditional index, IRI reported +2.46 °C for July to September and a weekly value of +3.3 °C in mid-October. ECCC notes that a value above 3.0 °C would be without precedent in the observed record.
The weekly value of 3.3 on the traditional index and the three-month value of 2.0 on the relative index describe the same event, so events should only be compared on the same index. The relative index is the better guide to how the atmosphere is likely to respond. The WMO also states that the strength of an event does not by itself determine its impacts in a given region.
Effects on Canadian winters
El Niño deepens the Aleutian Low and strengthens the ridge of high pressure over western Canada, the positive phase of the Pacific–North American pattern. Mild Pacific air reaches farther inland, and outbreaks of Arctic air become less frequent. ECCC states that El Niño often brings milder weather to western, northwestern and central Canada, mainly in winter and spring. The effect is largest from early winter to spring and small in autumn. The Canadian Centre for Climate Services (CCCS) adds that these winters tend to have less snow. In the three very strong events since the 1950s, CCCS found a stronger pattern displaced to the east: the largest winter warming lay east of the Rockies and extended through Ontario and Quebec to Atlantic Canada, while most of Nunavut was colder than normal.
The forecasts for this winter show a similar pattern, except that they are also warm in Nunavut. ECCC’s seasonal forecast, produced on 31 October 2026, makes a warmer-than-normal December to February the most likely of its three categories across almost all of Canada. The probability is 90% or more from northern Manitoba east through northern Ontario and Quebec to Labrador, 60 to 80% across most of the Northwest Territories, and lowest, at 40 to 60%, in southern Alberta and southwestern Saskatchewan. By chance alone, each category would have a probability of 33%. The same forecast favours a drier-than-normal winter in Alberta and the Rockies and shows no clear precipitation signal over most of Manitoba and Ontario.
The November run of the European seasonal model, as analyzed by Severe Weather Europe, also shows a mild winter for Canada under high pressure, with less snow than normal across the south.
Conditions so far in autumn 2026
Cold has been slow to accumulate this autumn. The usual measure of accumulated cold is freezing degree days: the running total of the number of degrees by which each day’s mean temperature falls below 0 °C. A day with a mean of −20 °C adds 20 to the total, a day at −5 °C adds 5, and a day at or above 0 °C adds nothing. In this piece, the total starts on 1 October each year. By 15 November 2026, Yellowknife had accumulated 67 freezing degree days. The median for that date is 207, taken over the 28 winters with complete records between 1990–91 and 2019–20. This year’s total and that of 2021 (69) are the lowest in the 46 autumns since 1980 for which I have data. October was the second driest at Yellowknife since 1942, and ECCC expects warmer and drier weather than normal across the Northwest Territories into December, which is likely to delay the start of ice road construction.
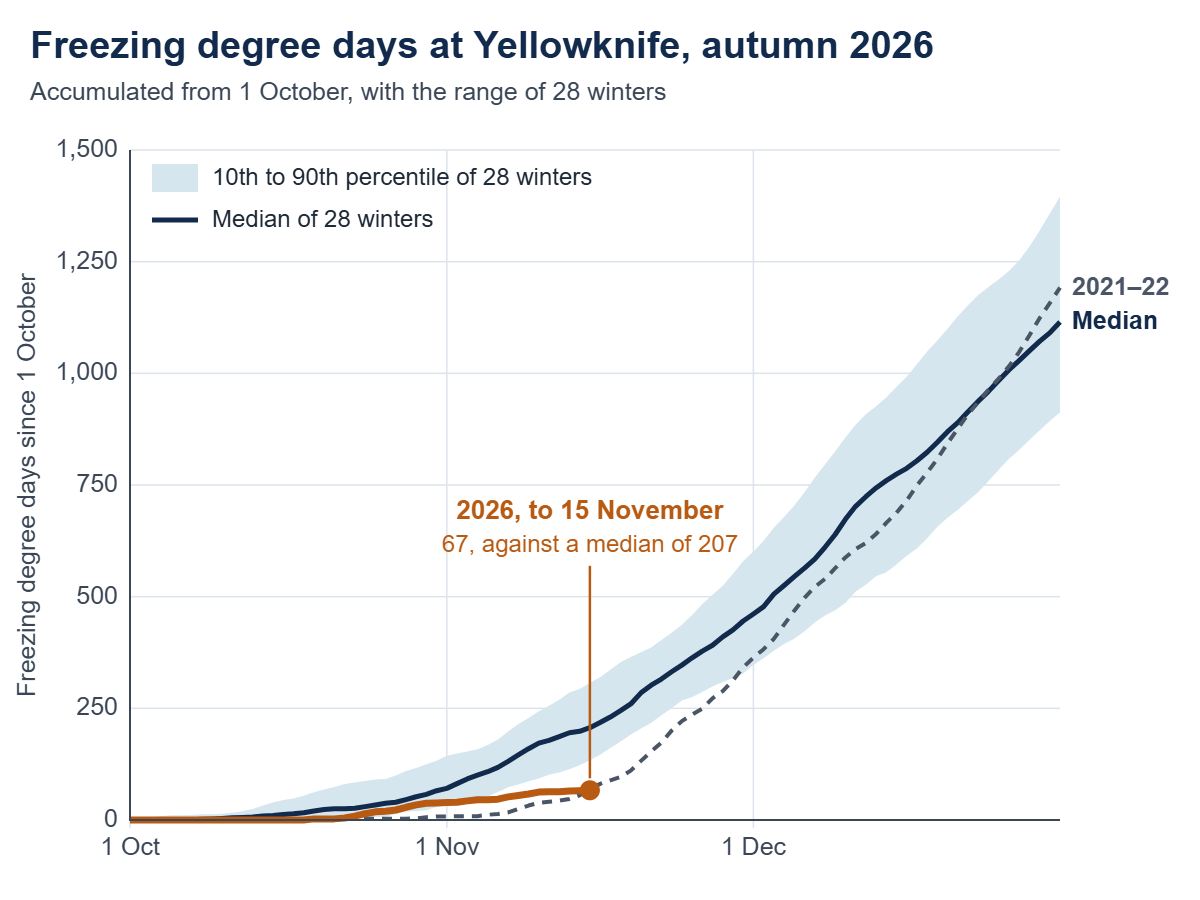
The start has been slow in the winter road region of Manitoba as well. From 1 October to 15 November, Island Lake accumulated 13 freezing degree days, against a median of 71 for the same period in 22 winters. That is the third-lowest total in the 32 autumns since 1990 for which I have data.
A slow start can still be made up. Autumn 2021 started as slowly at Yellowknife, and the winter that followed was colder than normal. The seasonal forecasts make that less likely this year.
Operations that depend on frozen ground
Canada builds roughly 10,000 km of winter roads each year. In northern Ontario, they link 31 remote First Nations, and in Manitoba, about 30,000 people rely on them for fuel, food and building materials. Mines, exploration camps and forestry depend on the same frozen months. So does much construction across muskeg and permafrost terrain, such as transmission lines, pipelines and seismic programs, because the ground cannot carry heavy equipment at other times of year.
Ice thickness and frost depth depend on accumulated cold, measured in freezing degree days. Ice thickness grows roughly with the square root of the freezing degree days (Stefan’s equation), and more slowly under snow. Operators set their start-up rules in freezing degree days, or in the ice, frost, snow and river ice dates that result. Examples:
- Manitoba waits for 300 freezing degree days before light construction equipment goes onto its winter road routes, and bars trucks when the air temperature rises above −5 °C.
- Research on the James Bay Winter Road in Ontario found that a favourable construction season needed at least 380 freezing degree days between 1 October and 31 December.
- The Tibbitt to Contwoyto Winter Road in the Northwest Territories needs 74 cm of ice to open and 100 cm for full loads.
- Alaska opens state land on the North Slope tundra to winter off-road travel when the soil at 30 cm depth reaches −5 °C and snow averages 15 cm on the coastal plain, or 23 cm in the foothills.
- Alberta starts winter weights for heavy haul once frost depth reaches 75 cm.
- River crossings open some weeks after freeze-up and close before break-up. On the Liard River near Fort Simpson, the gauge records its first ice-affected day around 30 October in the median year. The Northwest Territories opens the ice crossing there on 2 December and closes it on 18 April, on a five-year average.
Snow has two opposite effects. Packed snow is the running surface on land and protects tundra from traffic, so a winter with little snow slows construction. Undisturbed snow insulates ice and ground from cold air and slows ice growth, which is why crews clear it from lake ice before they measure and flood. The thresholds above are empirical values for particular routes and should not be applied to another site without local records. Bearing capacity also depends on the type and temperature of the ice, which is why hauling stops in warm spells even on thick ice.
Freezing degree days in past El Niño winters
I calculated freezing degree days at Big Trout Lake, a fly-in community in northern Ontario on the winter road network, from ECCC’s daily records. In the median winter, the count reaches 380 on 8 December. In 2023–24, which had a strong El Niño on the traditional index and was Canada’s warmest winter on record, it reached 380 on 18 December. December averaged −8.2 °C, about 10 °C warmer than usual, and by 31 January, the season had accumulated 1,035 freezing degree days against a median of 1,542, about two-thirds of the usual total. Because ice thickness grows roughly with the square root of freezing degree days, that corresponds to ice about 18% thinner than usual on that date, other conditions being equal.
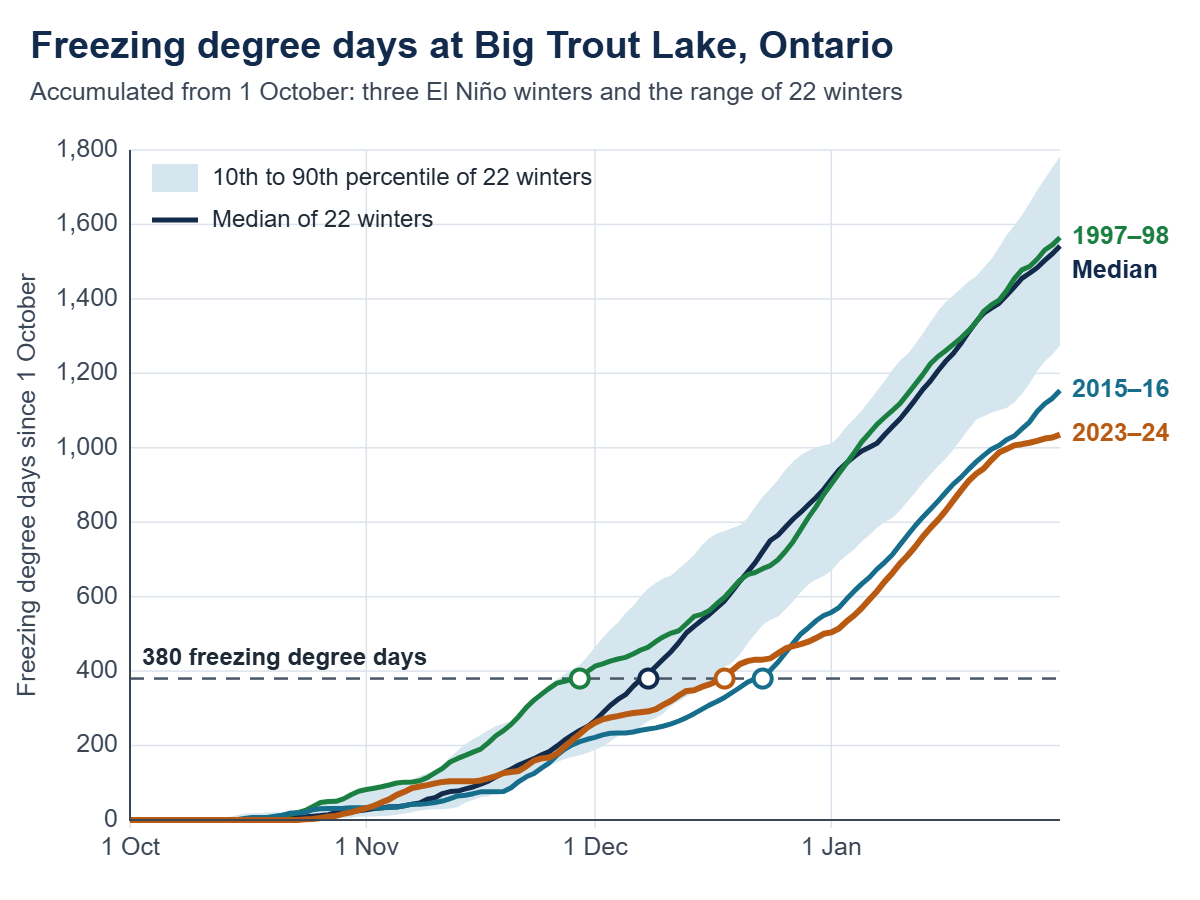
In the very strong El Niño of 2015–16, the count reached 380 on 23 December. The winter of 1997–98 was different: it began cold and reached 380 on 29 November, but turned very mild in late winter. At Island Lake in Manitoba, February 1998 averaged −7.8 °C, about 10 °C warmer than usual, and daily mean temperatures stayed near 0 °C for 10 consecutive days. Manitoba spent $14 million flying the remaining freight into the Island Lake region.
In 2024, First Nations in Manitoba and northern Ontario declared states of emergency. The 294 km winter road to Island Lake did not open until the third weekend of February. Air freight, the alternative, costs two to three times as much.
For winter 2026–27, these three winters show what to plan for in the winter road regions of northern Ontario and Manitoba: a construction season that starts 10 to 15 days late, as in 2015–16 and 2023–24, or one that starts early and turns very mild in late winter, as in 1997–98.
River ice: freeze-up and break-up
Where a route crosses a river, the season is set by freeze-up, when a stable ice cover forms, and break-up, when it fails. A crossing cannot be built until the river holds a continuous ice cover, and the ice then needs time to thicken. At Dawson City, the Yukon government needs about 10 days of ice cover at the site before it starts work on the ice bridge. In the El Niño winter of 2023–24, the Yukon River did not freeze over at that site. The government cited temperature fluctuations and an upstream ice jam, and no ice bridge was built.
Bonsal and colleagues compared river ice dates across Canada for 1950 to 1999 with El Niño and other climate patterns. In El Niño years, break-up came about five days earlier and freeze-up about five days later on average. The response was clearest in western Canada and at break-up, although few individual sites were statistically significant. La Niña had the opposite and larger effect.
I extended that comparison to 2024 with Water Survey of Canada hydrometric records, using the first and last days each winter on which ice affected the gauge, as in the Canadian River Ice Database. For 1973 to 2024, the last ice-affected day came about six days earlier in El Niño winters than in other winters on the Hay River, and about five days earlier on the Mackenzie River at Fort Simpson. Both differences are statistically significant. On the Liard, the Peel and the lower Mackenzie, the difference was two to three days and not significant. On the Moose, Albany and Hayes rivers, which drain to James Bay and Hudson Bay, there was no consistent difference. The first ice-affected day in autumn showed no consistent difference at any station. Stronger events did not bring earlier break-up: after the strong El Niño winters of 1982–83 and 1991–92, the ice cleared later than usual at Fort Simpson.
The record of break-up on the Yukon River at Dawson City begins in 1896. The two earliest dates, both 23 April, came in 2016 and 2019, each at the end of an El Niño winter, and 2024 is equal third at 28 April. Rivers without a consistent El Niño signal can still break up early in a particular year. The weather can cause this, through factors such as a mild winter that leaves thinner ice, an early and warm spring, strong sunshine and wind, or rain and snowmelt that raise the flow. So can the river itself, through factors such as the water level at which it froze, warmer water arriving from upstream, the timing of flow from its tributaries, ice jams that form and release upstream, and releases from dams. Fixed features, such as a river’s size and depth, the direction it flows, and the slope and shape of its channel, help explain why the response to El Niño differs from one river to the next. In 2024, after Canada’s warmest winter on record, the last ice-affected day was 17 April on the Moose River and 23 April on the Albany River, 11 and 8 days ahead of the median.
Mid-winter break-up is a separate hazard because it can cause ice jams and flooding. Newton and colleagues documented 52 events in western Canada and Alaska between 1950 and 2014. The Canadian events were in British Columbia, Alberta and the Yukon, and none was found at the stations examined in Saskatchewan, Manitoba, the Northwest Territories or Nunavut. Three days above freezing, or rain on snow, was enough to trigger an event, usually under the weather pattern that El Niño favours: a trough over Alaska and a ridge over western Canada. In northern Ontario and Manitoba, mid-winter thaws have been short even in El Niño winters: Moosonee had five days with a mean temperature above 0 °C from December to February in 2023–24, against a median of one.
On this evidence, crossings on the Hay River and on the Mackenzie River at Fort Simpson should be planned for a break-up five to six days earlier than in other winters, with a smaller and less certain shift on the Liard, the Peel and the lower Mackenzie. The records do not show a consistent delay in freeze-up. In British Columbia, Alberta and the Yukon, thaws and rain on snow should be watched as triggers of mid-winter break-up.
Limits of seasonal forecasts
A seasonal forecast gives probabilities, and forecasts for Canada tend to be more skilful in El Niño and La Niña winters than in neutral ones. The European Centre for Medium-Range Weather Forecasts (ECMWF), which runs the European model, cautions that a single model is typically overconfident and that outcomes outside the forecast range do occur. The CPC makes the same point about impacts: a very strong event makes them more likely but does not guarantee them.
Even a mild winter has cold outbreaks. In January 2024, during Canada’s warmest winter on record, an Arctic outbreak took temperatures in Alberta below −30 °C and set a record for electricity demand. Severe Weather Europe reports that two seasonal models show the polar vortex weakening in January and February this winter, which would raise the chance of cold outbreaks over west-central Canada. Cold spells are when ice can be flooded and snow packed, so crews and equipment need to be ready to use them.
This El Niño also comes on top of a long-term trend. Canada’s winters warmed by 3.6 °C between 1948 and 2024, so a mild winter now starts from a warmer baseline than in 1982–83 or 1997–98.
My recommended planning steps for owners and operators, winter 2026–27
These steps are for those who own, build or depend on winter roads, ice crossings and work sites on frozen ground, such as governments and road authorities, First Nations and remote communities, mines and exploration camps, oil and gas operators, utilities and construction contractors.
- State your thresholds in numbers: freezing degree days, ice thickness, frost depth, snow depth, freeze-up and break-up dates at each crossing, and the temperature above which hauling stops.
- Compare them with the records of the nearest climate and hydrometric stations: the usual date each threshold is reached, the range, and what happened in 1997–98, 2015–16 and 2023–24.
- Plan for a late start and an early end, and schedule fuel, oversize and heavy loads first.
- Track freezing degree days, measured ice thickness and river conditions against the plan every week from October.
- Use forecasts for the next two to four weeks to time flooding, packing and heavy hauls around cold spells, thaws and rain.
- Decide in advance what triggers the alternative, such as air freight, lighter loads, a summer barge or deferral, and include weather windows in contracts before mobilization.
We prepare weather and climate baselines, such as freezing degree days, frost depth and ice-season dates, and hydrometeorological forecasts for owners and operators of winter infrastructure.
Data and methods
Temperatures are daily means from ECCC’s climate stations. Freezing degree days are the sum of daily mean temperatures below 0 °C, counted from 1 October. Records from successive stations at the same place were joined and not homogenized: Big Trout Lake (6010738, 6010739, 6010735), Yellowknife Airport (2204100, 2204101), Island Lake Airport (5061376, 5061374) and Moosonee (6075425, 6075420). Where the Big Trout Lake records overlap, daily means differ by 0.1 °C on average. At Moosonee, the newer station is 0.4 °C colder in the cold season. “Usual” and the median refer to winters with complete records between 1990–91 and 2019–20: 22 at Big Trout Lake and Island Lake, 28 at Yellowknife and 20 at Moosonee. Gaps of up to five days were interpolated, and winters with longer gaps were excluded. Other choices of baseline move the median date at Big Trout Lake by one or two days. Data for autumn 2026 are preliminary. Big Trout Lake has no total for autumn 2026 because the station did not report from 22 October to 5 November.
River ice dates are from Water Survey of Canada hydrometric stations: the first and last days in each ice season carrying the ice flag (“B”) in the daily flow record. The flag shows that ice affected the gauge, not the extent or thickness of the ice cover. Stations: Hay River near Hay River (07OB001), Mackenzie River at Fort Simpson (10GC001), Liard River near the mouth (10ED002), Mackenzie River at Arctic Red River (10LC014, to 2019), Peel River above Fort McPherson (10MC002, to 2018), Moose River above Moose River (04LG004, from 1984), Albany River near Hat Island (04HA001) and Hayes River below Gods River (04AB001). El Niño winters are the 19 since 1973 in which the CPC’s relative index for December to February was 0.5 or more. Differences are between mean dates in El Niño and all other winters after removing the linear trend, tested by random permutation (4,000 shuffles) and not adjusted for the number of stations tested: p below 0.01 at Hay River and Fort Simpson, 0.10 at the Liard and above 0.19 elsewhere. The Dawson City dates are the tripod record of the Dawson City ice pool, 1896 to 2026.
Sources
- Alaska Department of Natural Resources, Division of Mining, Land and Water. (2026, October). Fact sheet: Off-road travel on the North Slope on state land. https://dnr.alaska.gov/mlw/cdn/pdf/factsheets/off-road-travel-on-the-north-slope-on-state-land.pdf
- Barrette, P. D., & Charlebois, L. (2018). Winter roads and climate adaptation: Prospective solutions through R&D [Paper presentation]. 2018 Conference of the Transportation Association of Canada, Saskatoon, SK, Canada. https://tac-atc.ca/wp-content/uploads/barrettep_winter_roads_and_climate_adaptation.pdf
- Barrow, E., Bleau, N., Booker, J., Livingston, T., Matthews, L., O’Sullivan, S., Patt, A., & Tyler, K. (2022). Winter ice roads in northern Ontario (Updated January 2026). ClimateData.ca. https://climatedata.ca/winter-ice-roads-in-northern-ontario/
- Bonsal, B. R., Prowse, T. D., Duguay, C. R., & Lacroix, M. P. (2005, September 15–16). Impacts of large-scale teleconnections on river-ice duration over Canada [Paper presentation]. 13th Workshop on the Hydraulics of Ice Covered Rivers, Hanover, NH, United States. https://cripe.ca/docs/bonsal-et-al-2005-pdf/
- Bonsal, B. R., Prowse, T. D., Duguay, C. R., & Lacroix, M. P. (2006). Impacts of large-scale teleconnections on freshwater-ice break/freeze-up dates over Canada. Journal of Hydrology, 330(1–2), 340–353. https://doi.org/10.1016/j.jhydrol.2006.03.022
- CBC News. (2024, March). No Dawson City ice bridge this year, Yukon gov’t announces to surprise of probably no one. https://www.cbc.ca/news/canada/north/no-ice-bridge-dawson-city-yukon-government-1.7148867
- Climate Prediction Center. (n.d.). Relative Oceanic Niño Index (RONI): Historical El Niño/La Niña episodes (1950–present). National Oceanic and Atmospheric Administration. Retrieved November 17, 2026, from https://www.cpc.ncep.noaa.gov/products/analysis_monitoring/enso/roni/
- Climate Prediction Center. (2026, November 12). El Niño/Southern Oscillation (ENSO) diagnostic discussion. National Oceanic and Atmospheric Administration. https://www.cpc.ncep.noaa.gov/products/analysis_monitoring/enso_advisory/ensodisc.shtml
- de Rham, L., Dibike, Y., Beltaos, S., Peters, D., Bonsal, B., & Prowse, T. (2020). A Canadian River Ice Database from the National Hydrometric Program archives. Earth System Science Data, 12(3), 1835–1860. https://doi.org/10.5194/essd-12-1835-2020
- Dosser, H. (2026, August 21). What the developing exceptional El Niño means for Canada in 2026-27. ClimateData.ca. https://climatedata.ca/news/what-the-developing-exceptional-el-nino-means-for-canada-in-2026-27/
- Environment and Climate Change Canada. (n.d.). Historical climate data [Data set]. Government of Canada. Retrieved November 17, 2026, from https://climate.weather.gc.ca/historical_data/search_historic_data_e.html
- Environment and Climate Change Canada. (2024). Climate trends and variations bulletin: Winter 2023/2024. Government of Canada. https://www.canada.ca/en/environment-climate-change/services/climate-change/science-research-data/climate-trends-variability/trends-variations/winter-2024-bulletin.html
- Environment and Climate Change Canada. (2026, August 21). El Niño. Government of Canada. https://www.canada.ca/en/environment-climate-change/services/weather-general-tools-resources/el-nino.html
- Environment and Climate Change Canada. (2026, October 31). Temperature and precipitation probabilistic forecasts: December 2026 to February 2027 [Maps]. Government of Canada. https://weather.gc.ca/saisons/prob_e.html
- Flis, A. (2026, November 12). New winter 2026/2027 forecast: A snowier shift and a mid-winter polar vortex signal. Severe Weather Europe. https://www.severe-weather.eu/long-range-2/winter-2026-2027-forecast-november-update-snowfall-polar-vortex-risk-united-states-canada-europe-fa/
- Gohil, E. (2026, November 10). Unusually warm, dry weather expected across NWT into December. Cabin Radio. https://cabinradio.ca/319333/news/weather/unusually-warm-dry-weather-expected-across-nwt-into-december/
- Government of Alberta. (2026, May 22). Road restrictions and bans. https://www.alberta.ca/road-restrictions-and-bans
- Government of the Northwest Territories, Department of Infrastructure. (2025, November 19). Winter roads average open/close dates. https://www.inf.gov.nt.ca/en/services/highways-ferries-and-winter-roads/winter-roads-average-openclose-dates
- International Research Institute for Climate and Society. (2026, October 19). ENSO forecast: October 2026 quick look. Columbia Climate School. https://iri.columbia.edu/our-expertise/climate/forecasts/enso/current/
- Madahbee, D. (2026, June 8). Potential Super El Niño: What northern First Nations should expect for winter 2026–2027. Ontario First Nations Technical Services Corporation. https://ofntsc.org/news/potential-super-el-nino-what-northern-first-nations-should-expect-winter-2026-2027
- Newton, B. W. (2018). An evaluation of winter hydroclimatic variables conducive to snowmelt and the generation of extreme hydrologic events in western Canada [Doctoral dissertation, University of Victoria]. UVicSpace. https://dspace.library.uvic.ca/bitstreams/6f31d664-220d-47bb-9142-ab6d48062fc4/download
- Newton, B. W., Prowse, T. D., & de Rham, L. P. (2017). Hydro-climatic drivers of mid-winter break-up of river ice in western Canada and Alaska. Hydrology Research, 48(4), 945–956. https://doi.org/10.2166/nh.2016.358
- Rutgers, J.-S. (2024, March 8). 8,000 kms of ice roads link Canada’s North. Erratic winters are wreaking havoc on the lifeline. The Narwhal. https://thenarwhal.ca/manitoba-ice-road-emergency/
- Stockdale, T. (2026, April 10). How confident should we be in a prediction of El Niño? European Centre for Medium-Range Weather Forecasts. https://doi.org/10.21957/54429ca7c5
- Tibbitt to Contwoyto Winter Road Joint Venture. (n.d.). About the winter road. Retrieved November 17, 2026, from https://jvtcwinterroad.ca/about/
- Tran, P. (2024, January 13). Critical emergency alert issued as Alberta’s power grid put under strain. Global News. https://globalnews.ca/news/10224558/alberta-grid-alert-day-two-polar-vortex/
- Water Survey of Canada. (n.d.). Historical hydrometric data [Data set]. Environment and Climate Change Canada. Retrieved November 18, 2026, from https://wateroffice.ec.gc.ca/
- World Meteorological Organization. (2026, April 27). Understanding ENSO indices in a warming climate [Briefing note]. https://wmo.int/files/understanding-enso-indices-warming-climate
- World Meteorological Organization. (2026, September 3). El Niño set to become very strong, raising risks of extreme weather into 2027 [Press release]. https://wmo.int/news/media-centre/el-nino-set-become-very-strong-raising-risks-of-extreme-weather-2027
- Yukon River Breakup. (n.d.). Breakup statistics: Yukon River, Dawson City. Retrieved November 18, 2026, from https://yukonriverbreakup.com/statistics/