

1960 to 2150
continuous climate record for the site
2
emissions pathways, low and high
+2.5 °C
observed warming at the site since 1950
3
future planning windows: the 2080s, 2110s and 2130s
The question
The Giant Mine Remediation Project must keep 237,000 tonnes of arsenic trioxide frozen underground and manage site water for generations. Conventional climate projections stop at 2100. What climate will the containment have to withstand in 60 years, and in 150?
What we did
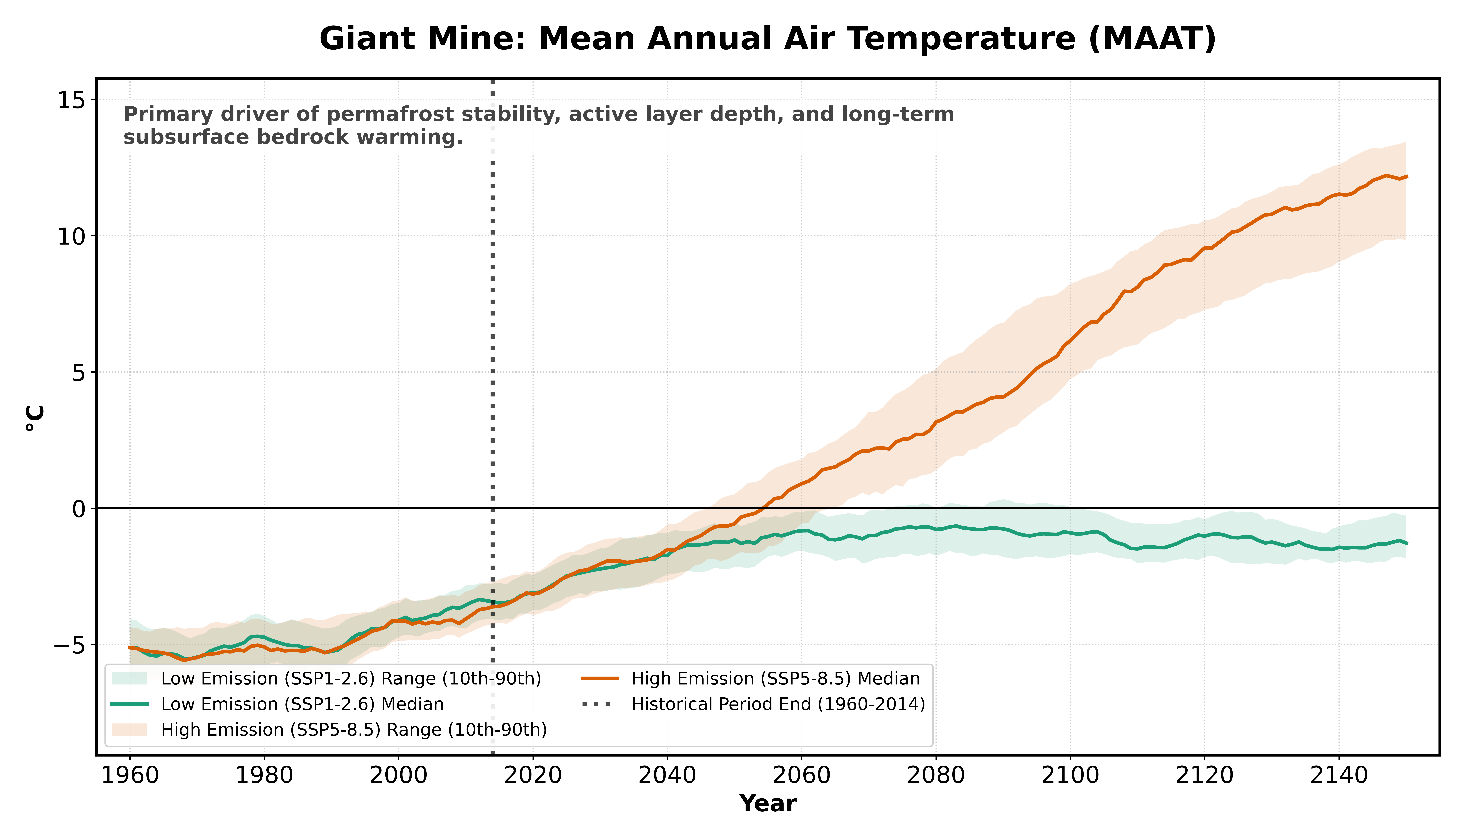
For the Climate Ready Mine Project, led by the University of Guelph with RFS Energy and the Giant Mine Oversight Board, we built a climate record for the site that runs from 1960 to 2150. We screened the CMIP6 archive for simulations that extend beyond 2100 (nine models do), bias-corrected them against observations, and produced a physically consistent monthly record under a low-emissions pathway (SSP1-2.6) and a high-emissions pathway (SSP5-8.5).
From it we derived the indicators that matter for perpetual care: thawing and freezing degree days, the length of the freezing season, cold-season and peak-month precipitation, evaporative demand and water balance, and high-wind months, for planning windows out to 2121 to 2150. The results went into a climate factsheet for the project team and a visual summary for the public.
- CMIP6 beyond 2100
- Bias-corrected
- Freezing degree days
- Water balance
What the project received
- Observed trends at the site from 1950: about 2.5 °C of warming, thawing energy up by more than 20% and freezing energy down by more than 16%
- Projections from 1960 to 2150 for two pathways, with the 10th to 90th percentile range of the models for every indicator and planning window
- A climate factsheet for engineers and decision-makers, and a visual summary for communities
- Presentations to the project team and advisory committee
What changed
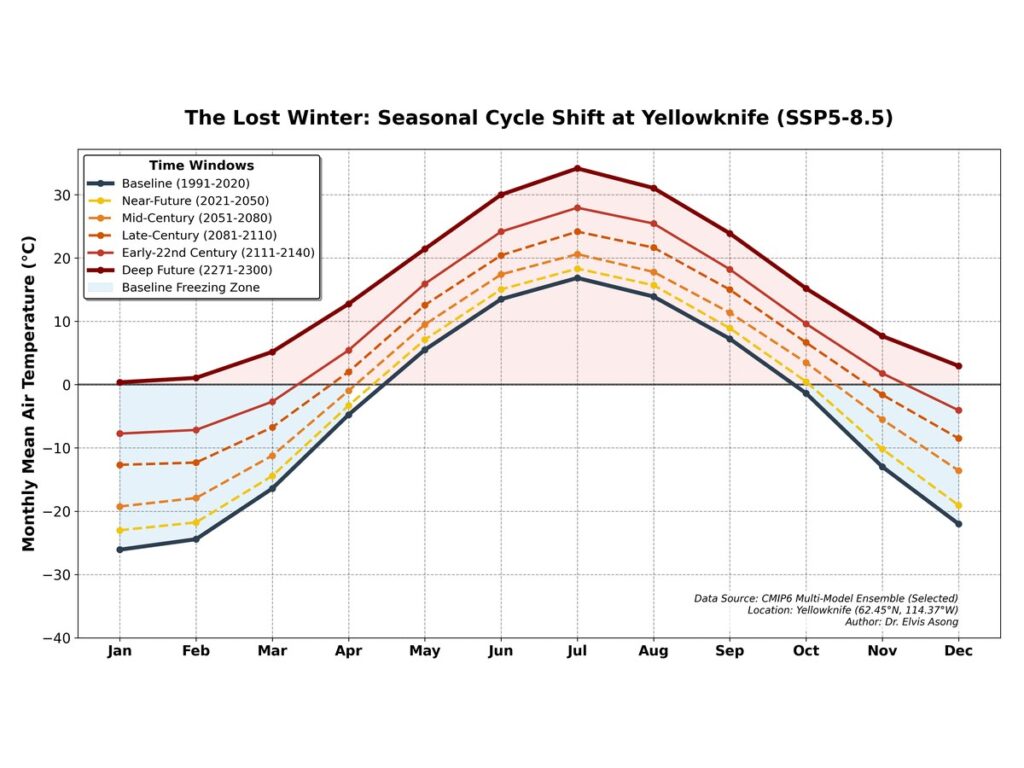
The project has a defensible evidence base for stewardship that extends past 2100, and the finding that shapes it: under high emissions, mean annual air temperature at the site rises above freezing before the end of the century, and the freezing season shrinks from about six and a half months to about three by 2121 to 2150. Under the low pathway it stays below freezing. Long-term care has to be adaptive and monitored, not fixed to the historical climate.
Indicators projected
- Mean annual air temperature
- Thawing and freezing degree days
- Freezing season length
- Cold-season precipitation
- Peak-month precipitation
- Evaporative demand and water balance
- High-wind months
Related service
We produce climate projections beyond 2100 for mines, dams and containment sites whose design life outlasts standard projections.
Discuss your project
Start with a 30-minute call with a climate scientist about your question, your data and your timeline.